Metrics#
Overview#
SnoozeWeb has several metrics exposed by the HTTP endpoint /metrics in OpenMetrics format.
snooze_process_alert_duration#
- Type:
Summary
- Unit:
Seconds
Average time spent processing a alert by source, environment and severity.
snooze_process_alert_duration_by_plugin#
- Type:
Summary
- Unit:
Seconds
Average time spend processing a alert by plugin and environment. Useful to track down
slowness in the processing.
snooze_alert_hit#
- Type:
Counter
Counter of received alerts by by source, environment and severity.
snooze_alert_snoozed#
- Type:
Counter
Total number of alerts snoozed by the snooze plugin.
snooze_alert_throttled#
- Type:
Counter
Total number of alerts throttled by the aggregaterule plugin. Alerts are grouped by
aggregate rule names.
snooze_alert_closed#
- Type:
Counter
Total number of alerts closed by a user.
snooze_notification_sent#
- Type:
Counter
Total number of notifications sent. Grouped by notification name.
snooze_action_success#
- Type:
Counter
Total number of notification actions that succeeded.
snooze_action_error#
- Type:
Counter
Total number of notification actions that failed.
Web interface#
Snooze web interface has a few built-in charts displaying these metrics under its dashboard section.
Alerts#
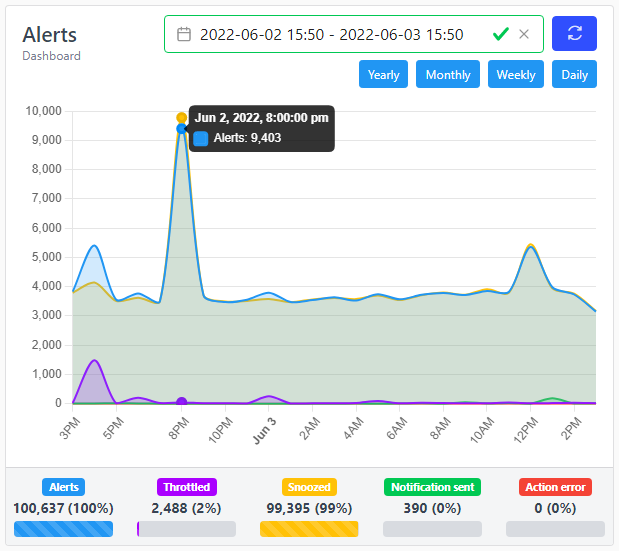
The time interval for displaying the metrics can be changed freely. It has a few presets and defaults to daily.
Hint
Clicking on a point of the chart will redirect to the alert section showing only alerts during around this period.
Clicking on a label will filter it in/out.
Changing the time interval will also affect all other charts time inteval as well.
Other charts#
A few other charts are also computed:
Alerts by Source
Alerts by Environment
Actions
Throttled Alerts
Snoozed Alerts
Alerts by Weekday